-
E-mail
gzsinoinstrument@163.com
-
Phone
13802743802
-
Address
Room 2201-03, Building A1, Greenland Central Plaza, No. 112 Science Avenue, Huangpu District, Guangzhou City
Guangdong Southeast Sci Tech Innovation Technology Co., Ltd
Relationship between interfacial rheological properties of food emulsifiers and foam stability
Date: 2025-12-04Read: 4
background
The expansion or expansion rheology of an interface describes how the interface responds to changes in area (increase or decrease). This reaction can be elastic or viscous. By using the oscillation drop method, the corresponding parameters of interfacial rheology can be obtained, namely the viscoelastic modulus E, elastic modulus E ', and viscous modulus E' [1,2].
Experimental Method
sample
Three different samples were tested, which were prepared into aqueous solutions according to their intended use before measurement (Table 1). These three samples are typical surface active additives in food. Hydrolyzed protein can be used as a flavor enhancer and is suitable for allergy patients. Quillaia extract is used in non-alcoholic beverages to support foam properties, while propylene glycol mannate is used as thickener, emulsifier or foam enhancer in ice-cream, seasoning or beer.

test method
The oscillation drop method is used to determine the viscoelastic modulus E, elastic modulus E ', and viscous modulus E'. Suck the sample into a glass syringe and connect it to the oscillation droplet module ODM of DSA100. The automatic detection and coupling of the syringe piston, as well as the high automation of the ADVANCE software, can achieve high precision and excellent measurement repeatability. A specific volume of liquid droplet is suspended below the syringe, and the volume of the droplet is oscillated sinusoidally through piezoelectric ceramics. Due to the migration of surfactants in the droplet, the surface tension of the droplet also shows a sinusoidal change (Figure 1). Based on surface tension, changes in droplet area, and phase angle, E, E ', and E' can be calculated automatically using the ADVANCE software.
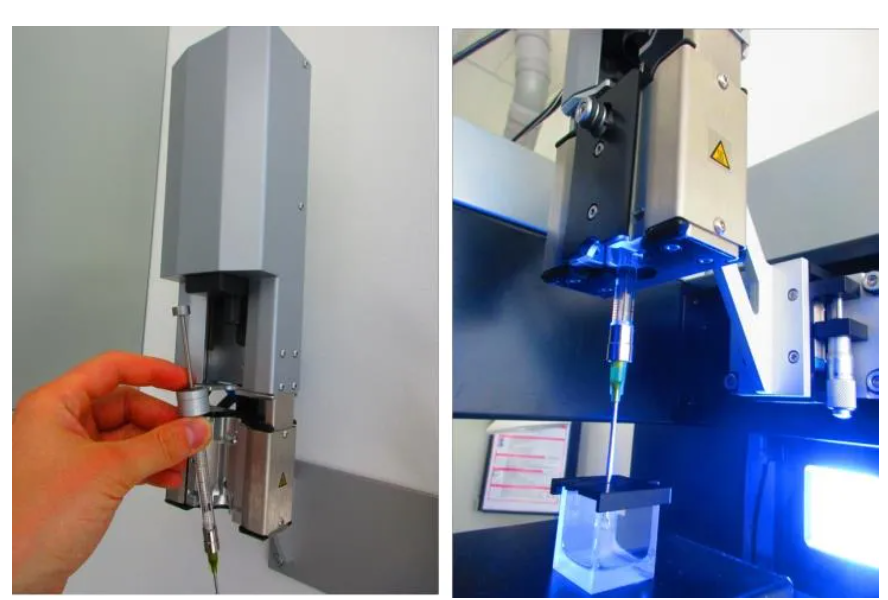
Figure 1: Experimental setup of DSA100 oscillation droplet module ODM. Left: Insert the syringe filled with liquid into the module. Right: Once the syringe is fixed, measurement can begin.
Measurements were taken at frequencies of 0.5, 1.0, and 3.0 Hz, as well as amplitudes of 3.6% and 4.8% (relative to deformation in the initial region) (data not shown). Such frequency and amplitude changes used to be complex, but now they can be easily set with the help of the ADVANCE software. Each droplet performs ten consecutive oscillation cycles and is used for evaluation.
result
The equilibrium surface tension values measured for the three samples were 37.8, 35.5, and 53.4 mN/m, respectively. Figure 2 shows the sinusoidal changes in surface area and surface tension of sample 1 droplets during the oscillation process. The ADVANCE software allows for intuitive viewing of raw data (blue), as well as area (yellow) and surface tension (blue) curves.

Figure 2: The area oscillation curve of Sample 1 (dark blue) and the obtained surface tension (light blue), with a frequency of 0.5 Hz and a frequency amplitude of 3.6%. It also displays the optimized sine function (area curve in yellow, surface tension in red).
Figures 3a and 3b show the elastic modulus E 'and viscous modulus E' of three samples. The error bar corresponds to the standard deviation of two measurements and is generally smaller than the corresponding symbol. The high degree of automation in ODM and its measurement indicates this high level of repeatability.

Figure 3a (top), 3b (bottom): The relationship between the elastic modulus E 'and viscous modulus E "of all three samples and the vibration frequency. The surface deformation amplitude is 3.6 ± 0.4%.
In all three samples, the elastic part dominated the interfacial rheological behavior (E '>>E "). At different frequencies, the elastic modulus of each sample varies slightly, but their results differ greatly from each other. Among them, sample 2 has the highest elastic modulus, about 100 mN/m. The elastic modulus of sample 3 is the smallest, about 20 mN/m. As the frequency increases, the viscosity modulus E "of all three samples decreases.
The test results are very meaningful for the food production process. For example, for sample 2, the ratio E '/σ=2.8 can be calculated according to the elastic modulus E' and surface tension. According to Kloek et al.'s model, if E '/σ>1, the distribution of initial bubble size in foam is very stable, and the decomposition process of Ostwald ripening can be slowed down or even stopped. Sample 2, the substance with high E '/σ is very suitable for stabilizing foam in the food industry.
Finally, it is worth noting that all measurements mentioned here were taken within approximately two and a half hours. Now, instruments that can quickly, easily, and accurately determine these key indicators are opening the door for users studying interface rheology.
Conclusion
After testing, the elastic modulus E 'of the three emulsifiers varies greatly, ranging from 20-110 mN/m. By combining the new oscillation drop module (ODM) with ADVANCE software, these key parameters can be easily, quickly, and accurately measured. Simple and intuitive measurements within the frequency and amplitude range, as well as highly automated software and hardware integration, can be used to comprehensively characterize interface properties, not limited to the food industry.