-
E-mail
shenbiaobiao@zryq.cn
-
Phone
19589992149
-
Address
No. 11 Yuehe Road, Chengyang District, Qingdao City, Shandong Province
Qingdao Zhongrui Intelligent Instrument Co., Ltd
Interpretation of HJ168: Clarifying Key Indicators for Method Validation
Date: 2025-11-03Read: 34

In the formulation and validation of environmental monitoring and analysis method standards,Technical Guidelines for Formulating Standards for Environmental Monitoring and Analysis Methods(HJ168-2020)A series of key indicators have been identified, which are the core basis for determining whether the method is scientific, reliable, and applicable. Method validation is a key assessment step before the implementation of standards, which directly affects the credibility of monitoring data.
This article focuses on the core indicators in method validation——inspectIndicators such as limit, lower limit of determination, precision, accuracy, uncertainty, precision, and correctness,Provide a detailed interpretation based on the standard original text.
0First, understand the basics: why are these indicators important?
HJ168-2020 is an environmental monitoring method Design ManualAll analytical methods used for monitoring water quality, atmosphere, soil, etc. (such as gas chromatography, spectrophotometry) must pass the "assessment" of these indicators in order to become standard methods. Simply put:
•Detection limit:Decision making methodCan you see itPollutants (qualitative);
• Determination of lower limit:Decision making methodCan you accurately measure itPollutants (quantitative);
• Precision:The results obtained by determining the method of measurement'Stable or Unstable'(Repeatability);
• Accuracy:The results obtained by determining the method of measurementDo not deviate from the truth(Accuracy);
• NoCertainty:The results obtained by determining the method of measurementWhat is the credibility range(Quantification of dispersion of results)
These indicators together constitute the "reliability defense line" of monitoring data.
02 Detection limit: the minimum threshold for "visible"
♦definition
Specific analytical methods can be used to extract data from the sample within a given confidence levelqualitativecheck outThe minimum concentration or minimum amount of the substance to be tested.
In layman's terms, the detection limit is like the "minimum magnification" of a microscope - only when the concentration of pollutants reaches this "magnification" can you determine "Oh, there are pollutants here"; If the concentration is lower than this, it can only be said that 'I didn't see it', and it's impossible to determine if there is any.
•Qualitative attributes:Only judge 'yes/no', do not guarantee 'accuracy';
• 置信度要求:Default confidence level of 99% (i.e. '99% confidence is not a misjudgment');
• Difference from instrument detection limit:The detection limit of the method includes the loss of sample pre-treatment (such as extraction and concentration), which is higher than the detection limit of the instrument (only the instrument itself) and closer to the actual monitoring scenario.

•Determination method and calculation formula
1) Target detected in blank experiment
According to all the steps of sample analysis, repeat n (n ≥ 7) blank tests (method standards established based on various portable and integrated instruments should increase the number of repeated measurements as much as possible according to the performance of the instrument), convert each measurement result into the concentration or content in the sample, and calculate the standard deviation of n parallel measurements.Multiply the fluctuation range (standard deviation) obtained from multiple measurements by the statistical coefficient (t-value) to ensure detection at a 99% confidence level.
MDL=t(n−1,0.99)×S
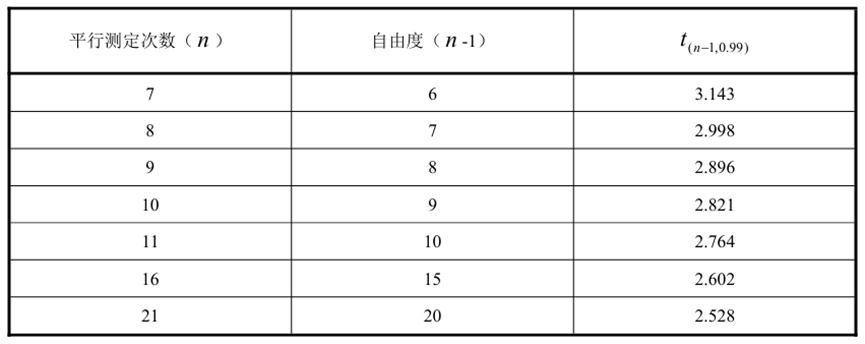
t(n−1,0.99)The one-sided t-distribution value with n − 1 degrees of freedom (n is the number of parallel measurements) and a confidence level of 99% (refer to Table A.1, for example, when n=7, t=3.143)
S:Standard deviation of n parallel measurement results (reflecting data fluctuations)
2) No target substance was detected in the blank experiment
According to all the steps of sample analysis, the concentration value or content is estimated as the detection limit of the method3-5 timesPerform n (n ≥ 7) parallel measurements on the sample. Calculate the standard deviation of n parallel measurements and determine the detection limit using the above formula. After calculating the MDL value, its reasonableness should be evaluated.

♦meaning
Used to determine whether the sample contains the target substance (such as a pollutant standard limit of 0.05 mg/L, if the method MDL=0.03 mg/L, pollutants close to the limit can be detected); If MDL=0.1mg/L, pollutants near the limit cannot be detected, and the method is not applicable. )

03 Determination of lower limit: the lowest starting point that can be accurately measured

04 Precision: Consistency of "Multiple Tests"
♦definition
Under specified conditions, the independent test resultsConsistency level.
In layman's terms, precision is like making a cake: if the same person uses the same recipe and produces similar taste and weight every time, it indicates "good precision"; If it's sweet this time and light next time, weighing 200g this time and 150g next time, it's' poor precision '.
•Quantitative characterization:Relative standard deviation (RSD)
• Repeatability:Same laboratory, same operator, same instrument, same conditions,Only the time is different;
• Reproducibility:Different laboratories, different operators, the same instruments, and the same conditions,Different laboratories and personnel (such as national verification).

Determination method and calculation formula
1) Determination method
• Concentration selection:Three concentrations: high (90% upper limit of calibration curve), medium (midpoint of curve), and low (near the lower limit of measurement);
• Measurement requirements:Each concentration is measured in parallel 6 times, and the entire process operation (including pre-treatment) is carried out;
• Data summary:Calculate the RSD of each laboratory, as well as the RSD, repeatability limit r, and reproducibility limit R between laboratories.
If a unified sample is used, the "inter laboratory relative standard deviation", "repeatability limit (r)", and "reproducibility limit (R)" need to be calculated (repeatability limit refers to the probability that the difference between two results in the same laboratory is ≤ r, which is 95%, and reproducibility limit is the same);
If non-uniform samples are used, the RSD range of each laboratory should be provided.
2) Relative standard deviation within the laboratory (core indicator of repeatability)
For samples of a certain concentration levelPerform n experiments in the i-th laboratoryParallel measurement, the relative standard deviation in the laboratory is calculated according to the following formula.

Xi: The average of n parallel measurements of a certain concentration sample in a certain laboratory;
Si: The standard deviation of the laboratory's measurement results.
3) Relative standard deviation between laboratories
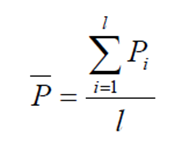
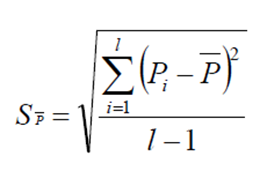
For samples of a certain concentration levelIn l laboratoriesConduct measurements and calculate the relative standard deviation between laboratories using the following formula.

x: The average value of testing samples at a certain concentration level in one laboratory;
S': Inter laboratory standard deviation.
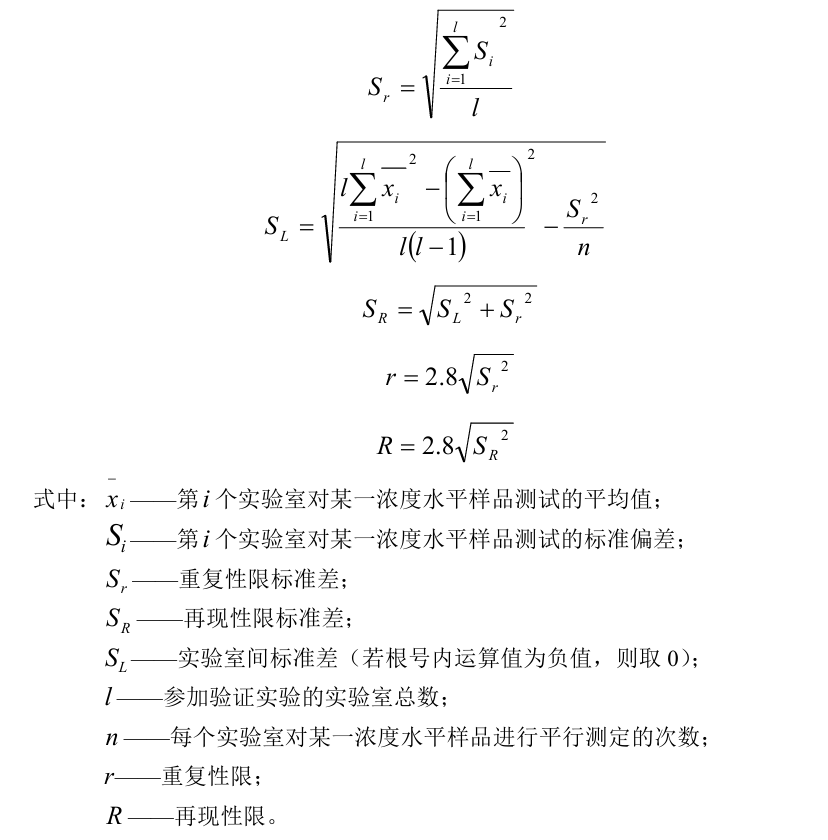
4)Repeatability limit (r) and reproducibility limit (R): "Maximum allowable difference"
Conduct l laboratory validation experiments on samples of a certain concentration level, with n parallel measurements taken in each laboratory. Calculate the repeatability limit r and reproducibility limit R according to the following formula:
05 Accuracy: How close is the "measured mean" to the truth
♦definition
The degree of consistency between the average of the measured values obtained from multiple repeated measurements and a reference value.
Many people confuse "correctness" and "accuracy", and HJ 168 clarifies the relationship between the two:
• Accuracy:Measured values andtruth valueThe degree of consistency. (accuracyRepresented by two indicators: accuracy and precisionConsider both mean bias and data dispersion. )
• Accuracy:Only looking at the mean andreference valueDeviation, not looking at scattered data.

Using the metaphor of 'shooting' is more intuitive:
High accuracy: bullets hit near the bullseye (average accurate);
High precision: bullets are all fired in the same area (with small dispersion);
High accuracy: The bullet is both concentrated (high precision) and close to the target center (high accuracy).
calculation formula
Accuracy usedRelative error "(reference sample)andRecovery rate of spiked samples (for actual samples)Measurement, these are two commonly used indicators.
Measurement of certified reference materials/standard samples: Each validation laboratory uses a unified sample with three different concentrations or contents (the same as precision validation): high, medium, and low. Each sample is measured in parallel at least 6 times according to the entire procedure, and the relative error of each concentration or content sample is calculated separately.
• Relative error:


Measurement of actual samples: Each validation laboratory should add a certain amount of certified standard substance/standard sample to 1-3 concentrations or contents of each sample type within the applicable scope for measurement (when the sample is detected, the spiked concentration should be 0.5-3 times the sample concentration; when the sample is not detected, the spiked concentration should include the applicable ecological environment quality standards, ecological environment risk control standards, and pollutant emission standard limits as much as possible). According to the entire procedure, each spiked sample should be measured in parallel at least 6 times, and the spiked recovery rate of each concentration or content sample in each type of sample should be calculated separately.
• Label recovery rate:
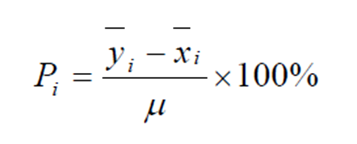
Xi: Average background concentration of actual samples (without labeling);
Yi: The average concentration of the spiked sample;
μ: Scalar addition (requirement: the concentration after adding the standard should be ≤ the upper limit of the calibration curve, and the scalar addition should be 0.5-3 times the original concentration)

The typical recovery rate is between 80% and 120%.