-
E-mail
470740401@qq.com
-
Phone
15990131321
-
Address
4th Floor, Building 8, Liangzhu University Science and Technology Park, Qixianqiao Village, Liangzhu Street, Yuhang District, Hangzhou City
Product Categories
Hangzhou Zhuoqi Electronic Technology Co., Ltd

Automatic weather station ZGQ-GPRS environmental detection equipment
NegotiableUpdate on 10/15
- Model
- Nature of the Manufacturer
- Producers
- Product Category
- Place of Origin
Overview
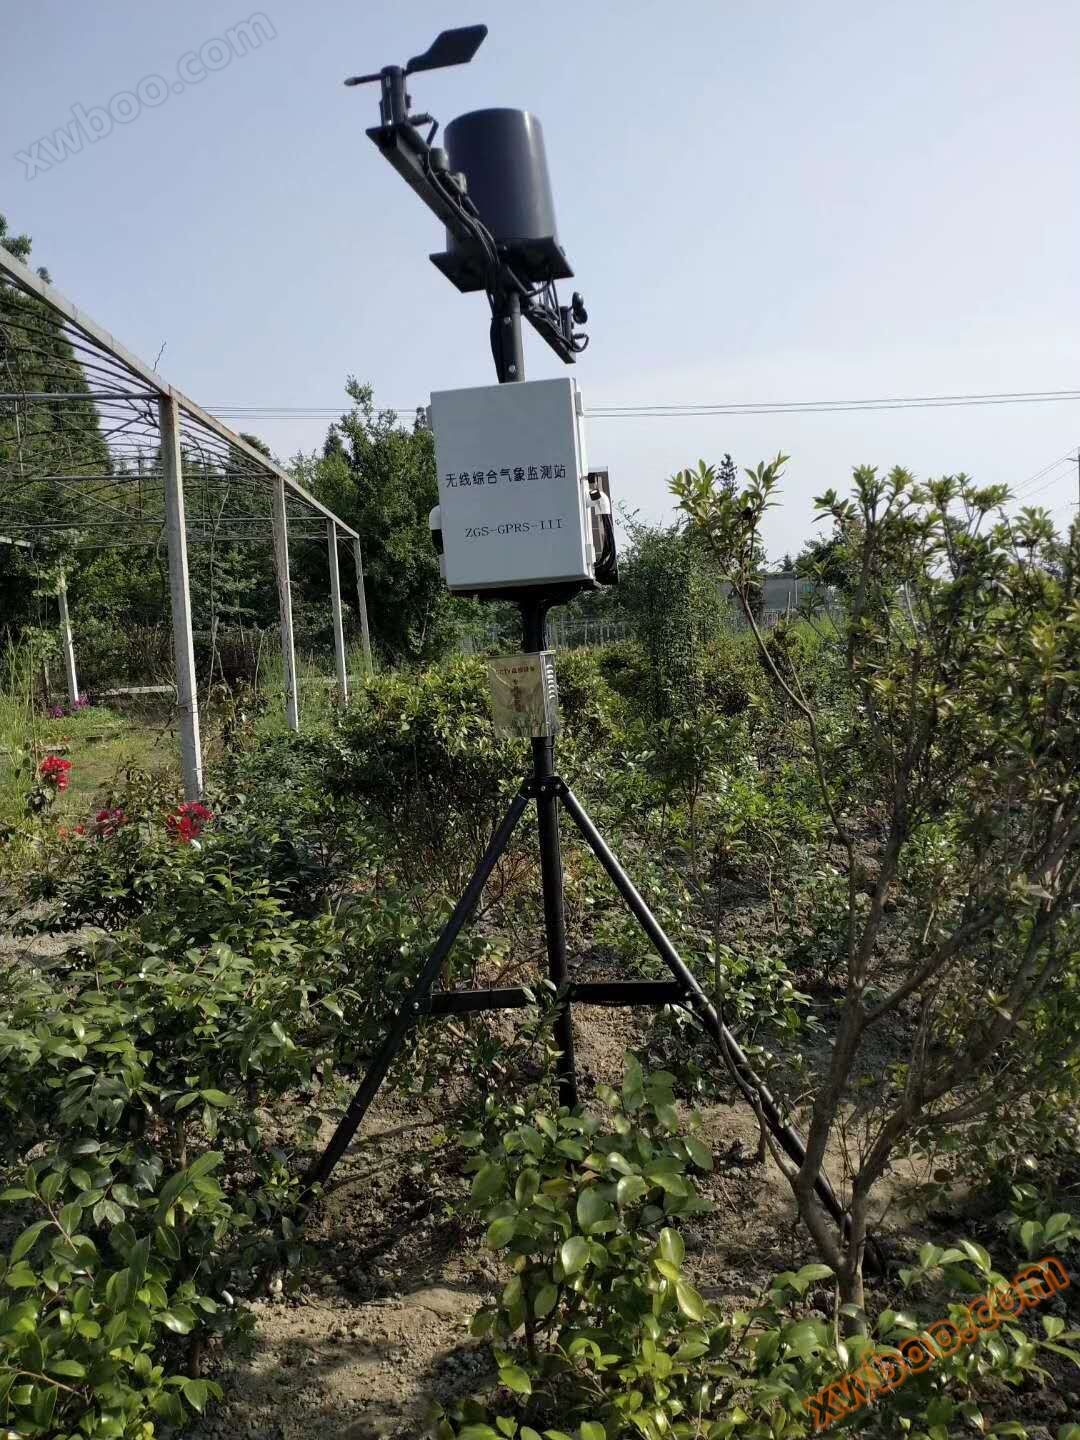
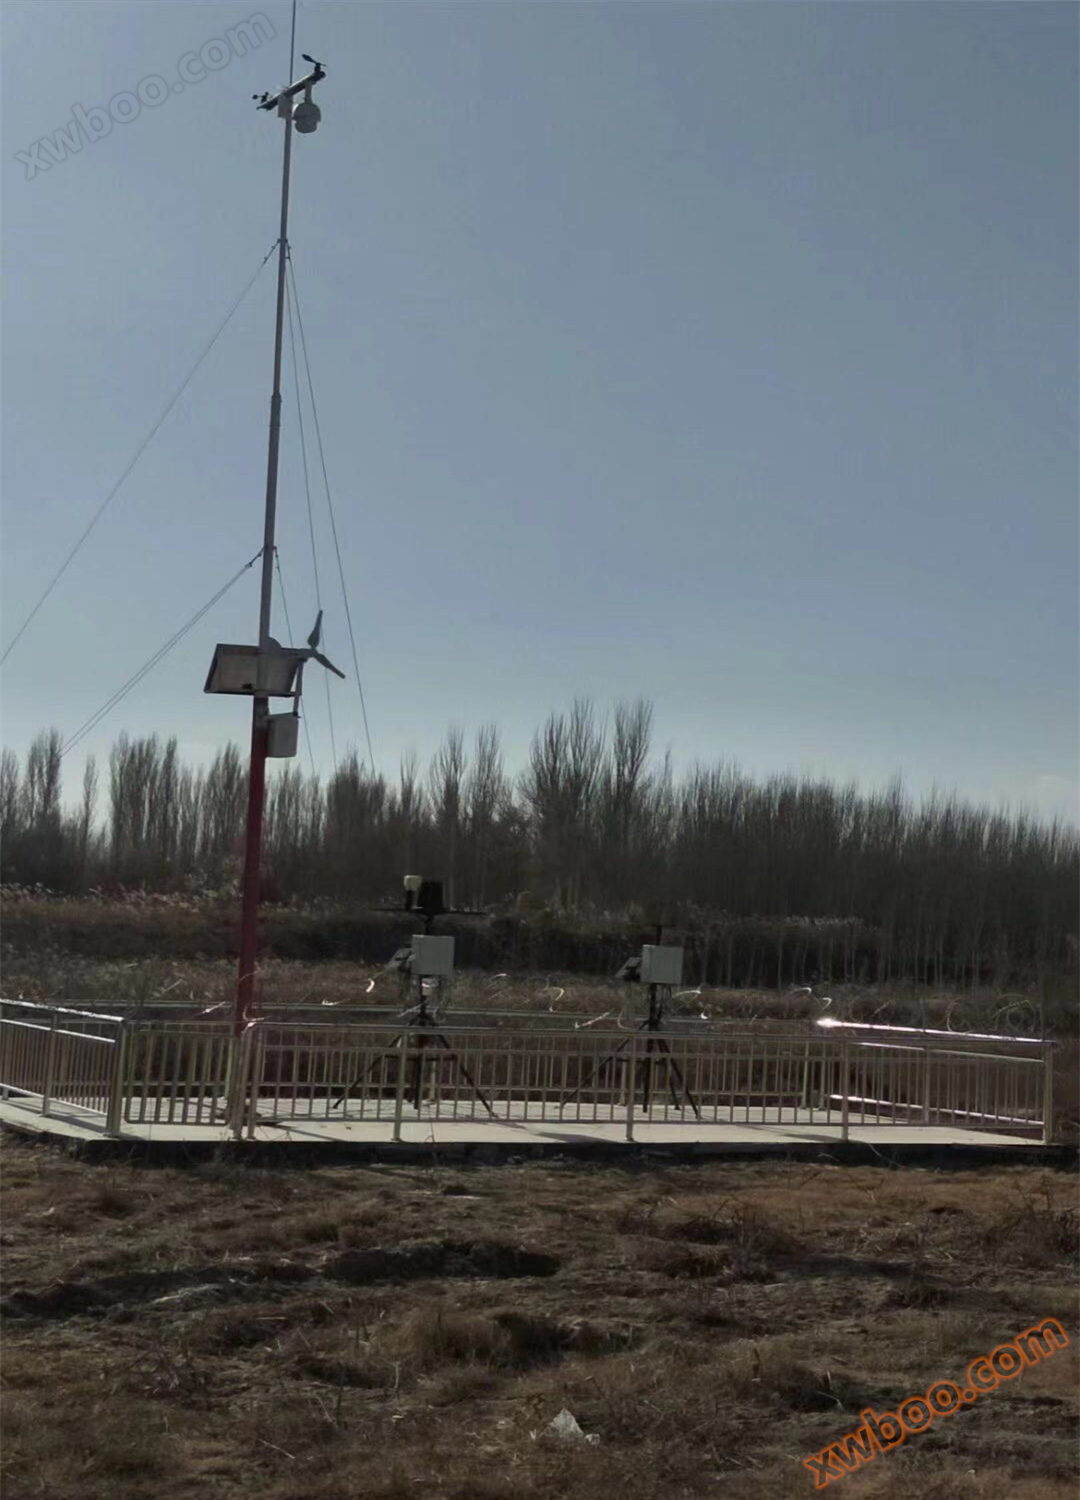
Product Description: Product Model: Automatic Weather Station ZGQ-GPRS Type 1. Instrument Usage Introduction: The automatic weather station is strictly produced in accordance with the International Meteorological Organization's meteorological observation standards, and has researched and developed multiple models and multifunctional automatic observation stations. The instrument can monitor conventional meteorological elements such as wind direction, wind speed, temperature, humidity, air pressure, rainfall, soil temperature and humidity. The instrument can also automatically record, warn of exceeding limits, and communicate data transmission. An automatic weather observation station consists of three essential components: weather sensors, weather data recorders, and weather environment monitoring software. It is often widely used for urban environmental monitoring in industrial and agricultural production, tourism, scientific research, meteorology, and other fields. 2、 Main functional parameters of the instrument:
Product Details
Product Description:
Product model: Automatic weather station ZGQ-GPRS type
1、 Introduction to Instrument Usage:
The automatic weather station is strictly produced in accordance with the meteorological observation standards of the International Meteorological Organization (WMO), and has researched and developed multiple models and multifunctional automatic observation stations. The instrument can monitor conventional meteorological elements such as wind direction, wind speed, temperature, humidity, air pressure, rainfall, soil temperature and humidity. The instrument can also automatically record, warn of exceeding limits, and communicate data transmission. An automatic weather observation station consists of three essential components: weather sensors, weather data recorders, and weather environment monitoring software. It is often widely used for urban environmental monitoring in industrial and agricultural production, tourism, scientific research, meteorology, and other fields.
2、 Main functional parameters of the instrument:
2、 Main functional parameters of the instrument:
| name | measurement range | resolution | Accuracy |
| ambient temperature | -50~+100℃ | 0.1℃ | ±0.5℃ |
| relative humidity | 0~100%RH | 0.1% | ±3% RH |
| Wind direction | 0-360 ° (16 directions) | 1° | ±5° |
| Wind speed | 0~70m/s | 0.1m/s | ±(0.3+0.03V)m/s |
| Rainfall | ≦4mm/min | 0.2mm | ±0.4mm |
| atmospheric pressure | 10~1100hPa | 0.1hPa | ±0.3hPa |
| soil temperature | -50~+80℃ | 0.1℃ | ±0.5℃ |
| soil moisture | 0~100% | 0.1% | ±3%RH |
| Soil pH | 0-14pH | 0.01pH | ±0.1pH |
| soil salinity | 8000mg/L | 1mg/L | 0~1000mg/L,<+9% |
| Total radiation | 0-2000w/m2 | 1w/m2 |
±2%w/m2
|
| sunshine duration | 0~24h | 0.1 h | ±2%h |
| carbon dioxide | 0~2000ppm | 1ppm | (40ppm+2%F•S) |
|
Various meteorological element sensors such as evaporation sensors, dew point temperature sensors, ultraviolet radiation sensors, and photosynthetic radiation sensors can be expanded and configured according to user needs. LED display screen (AC power supply) can be installed, with adjustable size and real-time collection of meteorological data and other set information. |
|||
| data acquisition instrument | Functions such as data collection, storage, communication, and analysis | ||
| power supply system |
Optional mains/solar/battery/multi power supply system
|
||
| communication system | RS232/RS485、USB、 Wireless GPRS, Ethernet and other communication methods | ||
| Special bracket | Install protective boxes, sensors, power supplies, communication equipment, etc | ||
| Lightning protection system | Lightning rod and accessories | ||
3、 The main functional features are as follows:
1. Collector: Equipped with industrial grade processing chips and ABS casing, it is lightweight, sturdy, and aesthetically pleasing overall. Equipped with a 192 * 64 full dot matrix LCD display, it can display graphics or 12 * 4 Chinese characters (optional 7-inch LCD display screen), suitable for various harsh environments.
2. Sensors: environmental temperature, humidity, wind speed, wind direction, air pressure, soil temperature, soil humidity sensors, soil pH, soil salinity, rainfall sensors, total radiation sensors, carbon dioxide, sunshine hours and other meteorological element sensors (optional according to needs).
3. Bracket: The surface of the main pole is treated with hot-dip galvanizing and electrostatic spraying technology, which has strong corrosion resistance. The main pole is 3.5 meters high and equipped with windproof cables.
4. Hub: If multiple sensors need to be connected simultaneously, they need to be connected through a hub. There is no difference in the six connectors between hubs, and the sockets can be freely selected without affecting accuracy.
5. Power adapter: (7.5-14.5V) (optional) The data acquisition device can be directly connected to the power adapter for AC power supply.
6. Data query function: Supports querying, exporting, and printing of various real-time and historical data at any time period.
7. Data statistics function: supports single element statistics function: can perform statistics on the maximum, minimum, and average values of a single element by year, month, day, hour, 10 minutes, or any time period.
8. Data chart function: Real time curves can be formed based on the collected data, and can be presented in intuitive ways such as bar charts, pie charts, etc.
9. There are two ways to upload data:
(1) Manual collection and upload: After pressing the [OK] button on the main interface, the instrument will upload real-time data from all sensors to the server.
(2) Automatic collection and upload: After setting the collection interval, the instrument automatically collects and uploads data to the server according to the set time.
Similar Product Recommend