-
E-mail
li.fu@perkinelmer.com
- Phone
-
Address
1670 Zhangheng Road, Pudong New Area
PerkinElmer Enterprise Management (Shanghai) Co., Ltd
Material Vision | ATR Imaging Analysis of Drug Tablets
Date: 2025-11-08Read: 7
In recent years, regardingChemical imaging technology for drug tabletsReceived increasingly widespread attention. With the improvement of technology and the popularization of applications, chemical imaging has become an effective means of obtaining key quality parameter information, which is often difficult to accurately determine through other technologies. In addition to large pharmaceutical companies, generic drug manufacturers and even regulatory agencies have widely recognized the value of this technology in production troubleshooting, production scale improvement, and root cause analysis.
Among numerous imaging technologies,Near infrared (NIR) imaging technologyWith its significant advantages, it has gained the most attention and demonstrated sustainable development potential as a Process Analysis Technique (PAT) tool. Although Raman imaging and other chemical imaging techniques such as mid infrared diffuse reflectance have their own advantages and disadvantagesNIRIn terms of technical implementation, operational convenience, and sample adaptabilityMore advantageous.
The data generated by this technology is also more easily understood by many users in the field, as they may have experience in macroscopic near-infrared spectroscopy analysis of tablet components. However, NIR imaging under existing technologies (whether Fourier transform, adjustable filters, or fixed filters) has inherent limitations, which stem from the measurement principle itself rather than technical defects.
First
The penetration depth of incident light in the sample is relatively large (on the order of tens of micrometers), and the diffuse reflection characteristics can cause the image to be substantially blurred. According to estimates, the penetration depth of the sample is at least 10 microns (depending on parameters such as particle size and filler), but many tablet components actually have a particle size of less than 10 microns when mixed in a blender. Therefore, unless these components form aggregates, this technique is difficult to obtain images that clearly display the spatial distribution of component characteristics.
It is worth noting that existing literature on NIR imaging has not yet addressed single particle size distributions below 10 microns. Research cases often focus on small particle aggregates or larger particles ranging from tens to hundreds of micrometers, while particles smaller than 10 micrometers should exist in the distribution. For certain components (such as magnesium stearate), even at high concentrations, if aggregates of about 30-40 microns or larger are not formed, they may be difficult to detect by NIR imaging due to their relatively small particle distribution throughout the matrix. In fact, some active ingredients with a content below 1% cannot be detected unless they form aggregates.
secondly
The NIR spectra measured in imaging often have high overlap. In macroscopic near-infrared spectroscopy analysis, the discriminability of NIR spectra is usually lower than that of corresponding Raman imaging or mid infrared spectroscopy, and this disadvantage is more prominent in NIR imaging with lower signal-to-noise ratio than macroscopic near-infrared spectroscopy analysis. These two factors result in imaging analysis being highly dependent on chemometric analysis of spectral data. In addition, subsequent image analysis also requires the use of pixel statistical techniques, which typically require classifying individual image pixels according to chemical categories. However, in practical operation, this is extremely challenging because the component spectra presented by individual pixels in NIR images are rarely pure. This makes the overall analysis of NIR images more difficult, as assigning "1" or "0" values to grayscale pixels often carries a certain degree of subjectivity.
Compared to other technologies, ATR (attenuated total reflection) spectral imaging technology in mid infrared spectroscopy analysis has shown significant advantages in this application field: its spatial resolution is about an order of magnitude higher than NIR imaging, and it has now reached the single particle size level of many components entering processing, which is less than 10 microns.It has been confirmed that ATR imaging technology has a spatial resolution better than 5 microns4Secondly, compared with NIR, the spectra in the image have higher contrast and are easier to distinguish different components; Thirdly, this technology is actually a surface analysis technique, and when using the optical configuration described below, the sample penetration depth is only about 1-2 microns. This makes the spectrum of a single pixel relatively pure, greatly reducing the workload of subsequent image analysis and having significant advantages over NIR technology.Some techniques in hyperspectral NIR imaging analysis can be fully applied to ATR imaging analysis.
ATR technology also has the following advantages:
•Can directly call large-scale commercial spectral libraries for qualitative identification;
•For substances that are difficult to identify with NIR technology (such as certain anhydrous inorganic salts), ATR technology can generate high contrast spectra.
We havePerkinElmer Spotlight ™ 400 Microscopic Imaging System Developed ATR Attachment,And complete multiple drug tablet testsThis application literature presents ATR imaging measurements of commercially available drug tablets and validates many of the technical advantages mentioned earlier.This technology marks a significant breakthrough in drug tablet imaging technologyAlthough it is still in its infancy, it is expected to play an important role in the analysis of drug tablets and mixtures in the future.
Experimental Design
01 Sample preparation and situation introduction
This article uses uncoated whole drug tablets (including prescription and over-the-counter (OTC) drugs) and obtains samples of known raw materials present in the tablets. The ingredients of prescription drugs include: active ingredients, microcrystalline cellulose, calcium hydrogen phosphate, starch, and magnesium stearate; The raw materials of OTC products are aspirin, acetaminophen, caffeine, as well as various organic and inorganic excipients. In this example, the tablet thickness is 2-3 mm, with vertical sides and a flat surface.
The ATR attachment uses germanium crystals (Figure 1), which are attached to the surface of the tablet. The design feature of this attachment is that it can locate the target area (ROI) of the sample through a visible light microscope camera, and the ATR sampling surface can accurately cover the ROI without moving the sample. The crystal bonding end can form a circular sampling area, within which different sizes of square or rectangular imaging areas can be defined. Calculated at a pixel size of 1.56 microns, the 500 × 500 micron area will contain over 102000 independent spectral data.

Figure 1. ATR Sampling Configuration
To conduct the most comprehensive image analysis, it may be necessary to obtain ATR spectra of tablet raw materials as a reference. The best solution is to directly use the ATR imaging system to measure the spectrum, rather than extracting it from a standard reference library. Although the latter approach can also be used, it will result in a decrease in the quality of image analysis. This article uses the commonly used standard potassium bromide (KBr) microplate attachment in infrared spectroscopy analysis to prepare simple microplates for each raw material of the tablets. When using the standard microplate (2mm mold) attachment, handheld pressure can be used to prepare microplates suitable for ATR data acquisition. After compression molding, transfer the tablet to the ATR attachment and perform small area imaging measurements of 50 × 50 microns on the pure components. Based on these images, use software to calculate individual reference spectra. The reference image acquisition for each component only takes a few minutes, and this type of operation usually only needs to be performed once.
02 imaging
Using standard Spotlight equipped with ATR imaging accessories ™ 400 Microscopic Imaging System for Image Acquisition.The system generates images through the collaborative work of MCT array detectors and mobile sampling stations/ATR attachments. The ATR crystal is fixed on the surface of the sample and remains relatively stationary with the sample - the sample and ATR crystal as a whole move relative to the detector. The pixel size of the image is 1.56 × 1.56 microns (optional 6.25 × 6.25 microns), and the spectral resolution is 16 cm-1. The actual image size range collected in this article is from 100 × 100 microns to 400 × 400 microns, with a total acquisition time ranging from 1 minute to about 40 minutes.
Image data processing includes steps such as spectral differentiation, normalization, principal component analysis, and least squares full spectrum curve fitting. Another 5 underwent further graphic image enhancement and statistical analysis.
Results and Discussion
As a contact technology, once the sample comes into contact with the crystal surface, it is contaminated, so the crystal needs to be cleaned before each imaging. However, unless the tablet particles have strong adhesion, the cleaning process is relatively rapid.
As a contact technology, once the sample comes into contact with the crystal surface, it is contaminated, so the crystal needs to be cleaned before each imaging. However, unless the tablet particles have strong adhesion, the cleaning process is relatively rapid.
Figure 2a shows the visible light microscopy image of the tablet surface. Although some particle structures can be identified, visible light images alone cannot effectively distinguish each component particle.
Figure 2b clearly presents the distribution of starch components. This image was obtained by performing multiple processing steps on ATR imaging data as described in this section.
By using a similar method, the distribution pattern of each component can be derived, and then a synthetic image can be constructed. This article combines images of three main components into a single RGB (red/green/blue) three channel composite image (Figure 2c), which is commonly used in NIR imaging of such products. The difference of this test is that compared with NIR imaging, its spatial resolution is significantly improved, the spatial contrast of the image is higher, which can obtain clearer and more detailed tablet surface images in a relatively short measurement time, and can locate micro areas that cannot be detected by current NIR imaging technology.
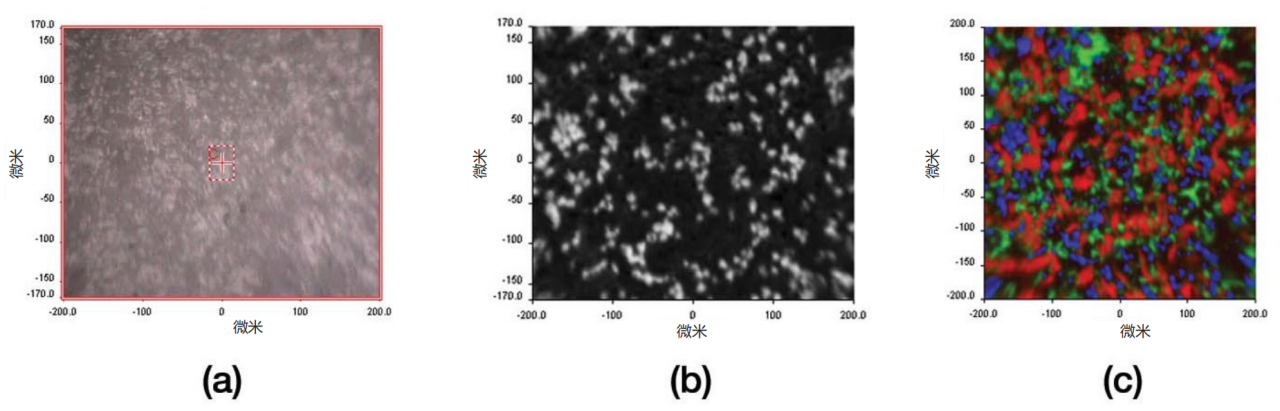
Figure 2.3 Visible light images of the tablet surface of the main components (a), differential processed single component infrared imaging images (b), and composite images (c) (click to view large image)
01 Raw material spectrum
Figure 3 shows the ATR spectrum of a tablet raw material and its corresponding first-order differential processed spectrumThrough ATR imaging, it can be observed that the illumination field on the entire surface of the crystal element is not completely flat, mainly manifested as a smooth baseline shift phenomenon in the measured spectrum of the entire crystal region. This problem can be easily solved by using first-order or second-order differentiation. It should be pointed out that compared with near-infrared imaging, the spectral characteristics of the raw materials in this method are more significant, which provides a greater possibility for using simpler univariate methods in image analysis. During the testing process, polyvinylpyrrolidone, a common raw material that does not exist in the tablets, was added as a test sample to verify the effectiveness of subsequent data processing.
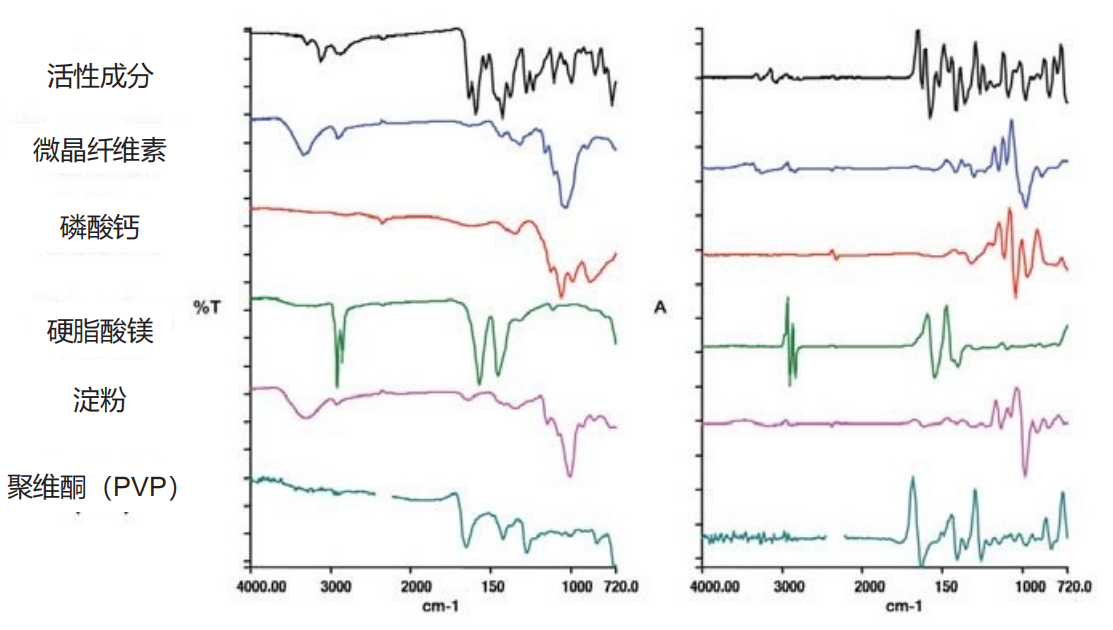
Figure 3. Raw Material Composition (Click to View Large Image)
02 Detecting the presence of tablet components
The first step is to confirm whether there are spectral features of the raw material in the image spectrum. This step is achieved through the "Target" function of the software. Firstly, preprocess the image spectrum (first-order differentiation and remove the carbon dioxide absorption region), and then extract the main independent spectral contributions through principal component analysis (PCA). Subsequently, the raw material or "target" spectrum is fitted with a linear combination of PCA principal components, and the degree of fit can determine whether the target spectrum exists in the image spectrum.Figure 4 shows the detection results of the five components in the tablet.Five componentsThe fitting quality is excellent,However, the fitting quality of polyvinylpyrrolidone is poorThis method has been effectively validatedreliability.
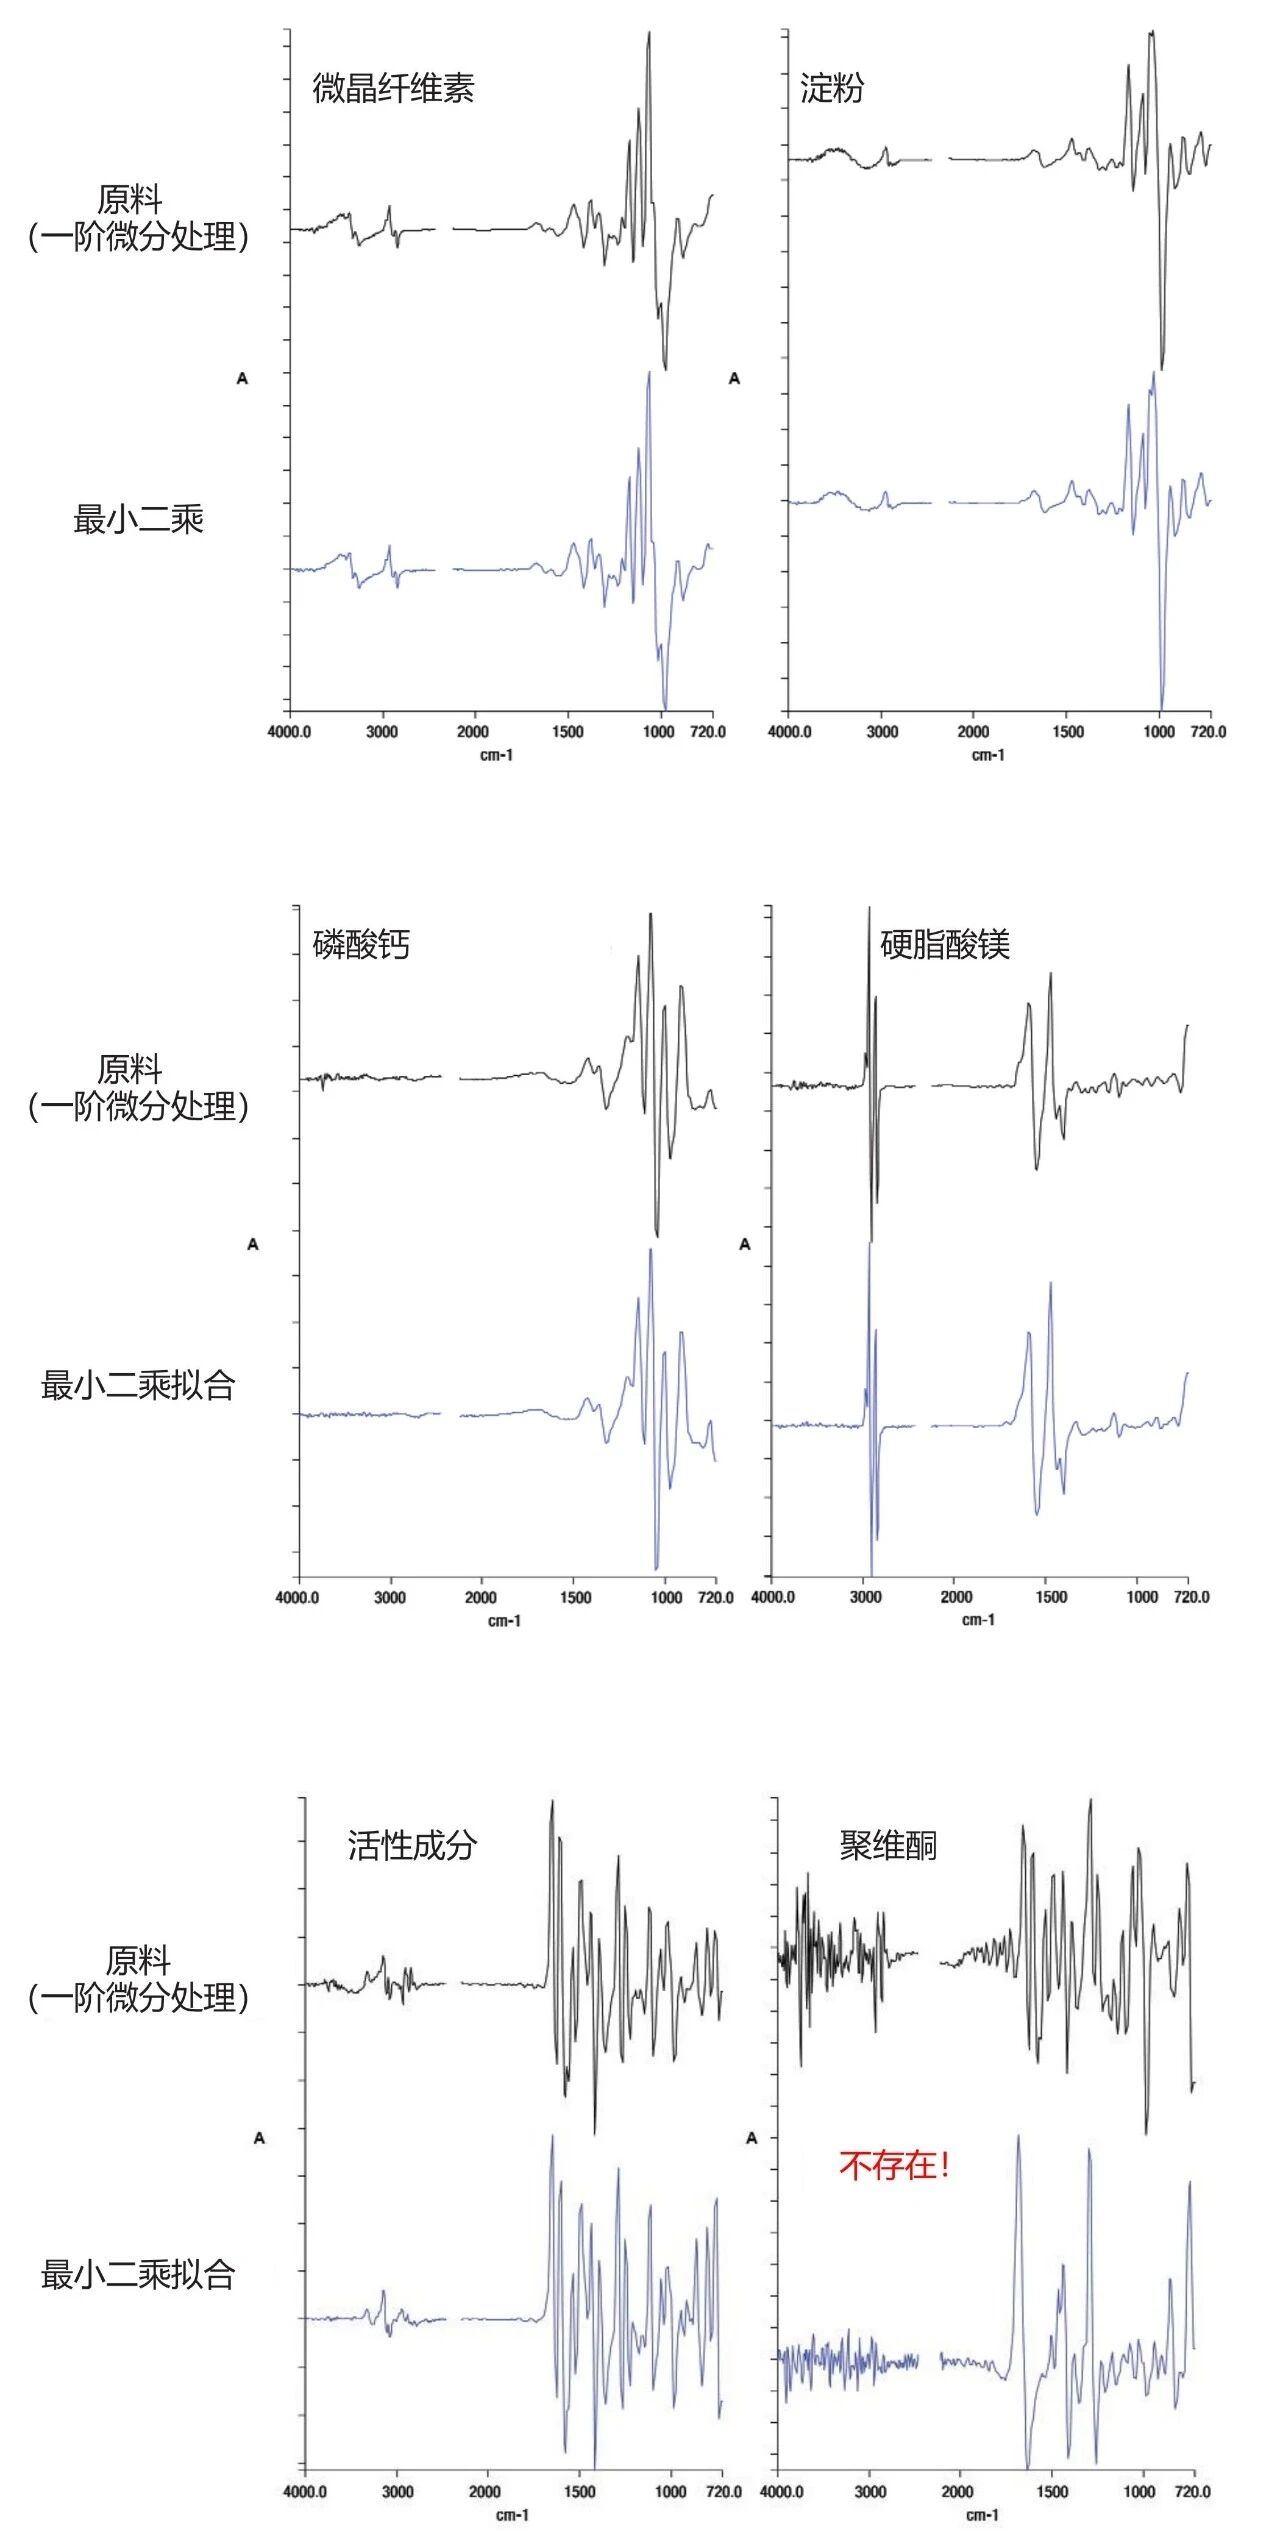
Figure 4. Detecting the presence of raw materials
03 Evaluate the distribution of each component within the tablet
After confirming the presence of the target spectrum in the image spectrum, the next step is to generate a distribution map of each component by estimating the relative abundance of each pixel in the image. Although there are multiple methods, research has found that simple full spectrum curve fitting methods are effective for this five component system (assuming no chemical reactions between components and obtaining pure raw material spectra). After examining the residual images and checking for the presence of other chemical components through principal component analysis, it is only necessary to model the spectra of each pixel as a linear combination of the raw material spectra. It should be noted that if there is strong cross correlation between target spectra (i.e. multiple target spectra have multiple common characteristic peaks), the reliability of this technique will be reduced. In this example, although there is a clear correlation between the spectra of microcrystalline cellulose and starch, the difference is still sufficient to ensure good least squares curve fitting conditions.Figure 5 shows the spectral curve fitting results of five componentsThe pixel intensity in each image intuitively reflects the relative abundance of the target spectrum in the image spectrum.
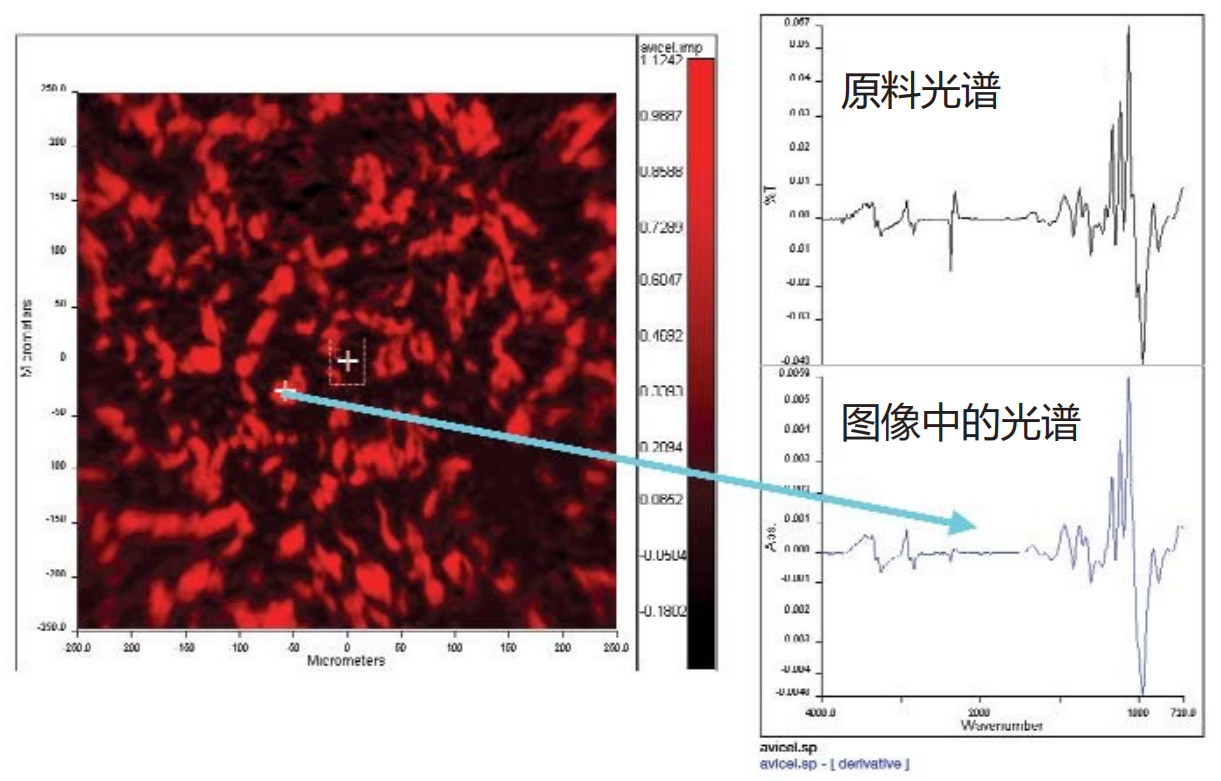
Figure 5a. Least squares fitting image of microcrystalline cellulose
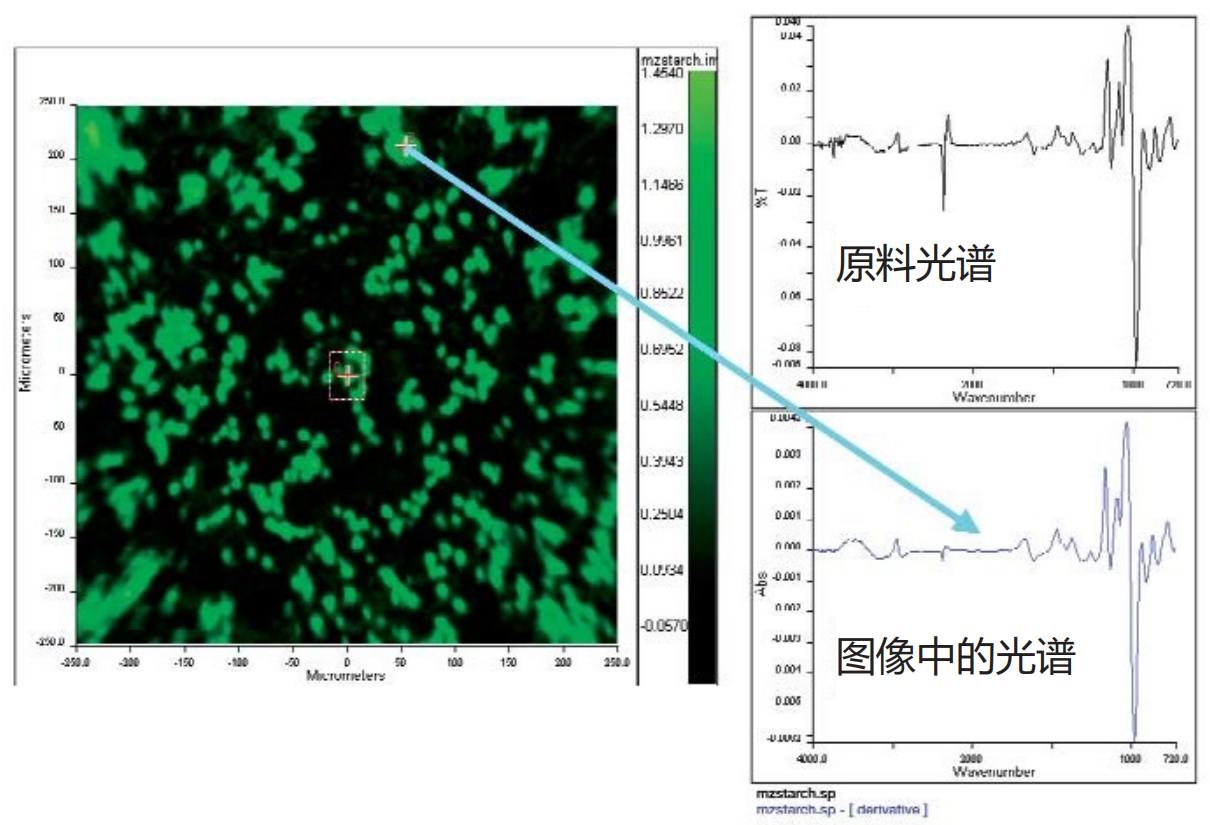
Figure 5b. Distribution of Starch

Figure 5c. Distribution of Calcium Phosphate
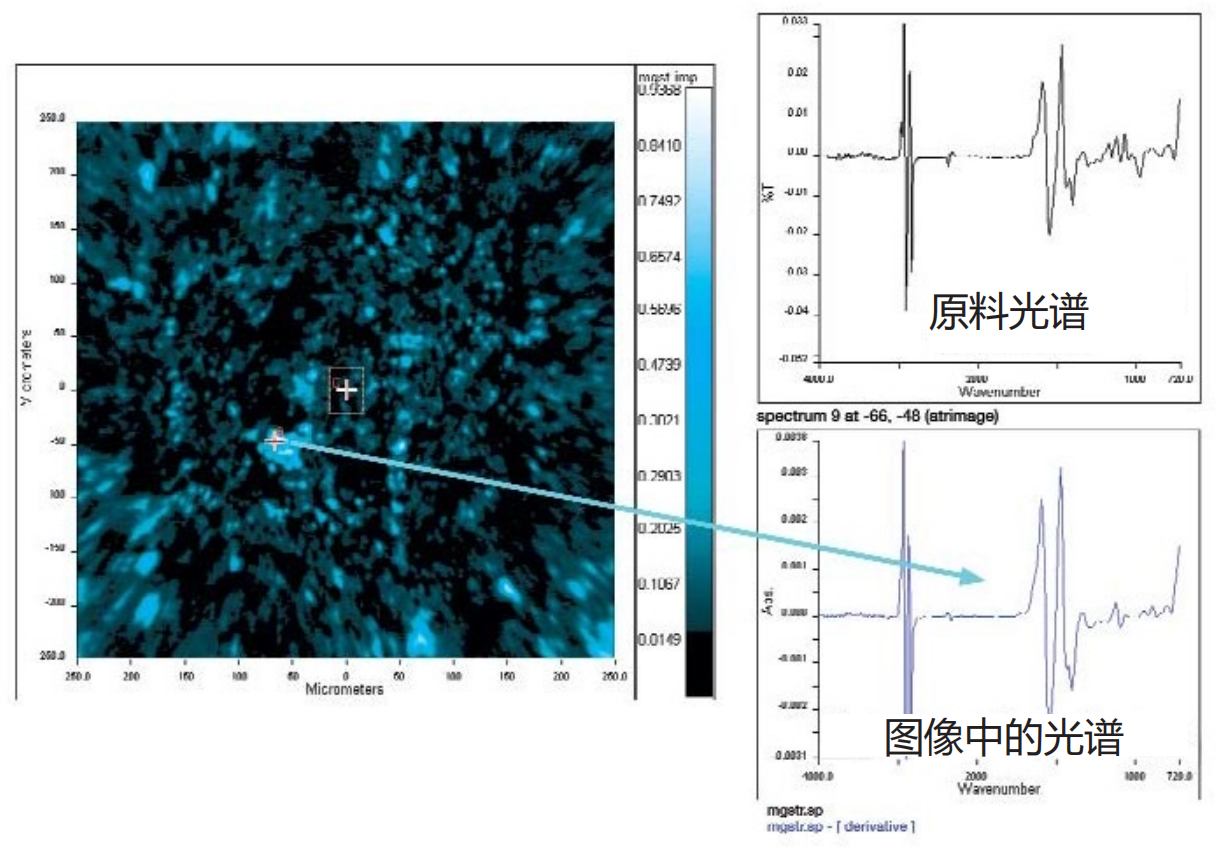
Figure 5d. Distribution diagram of magnesium stearate
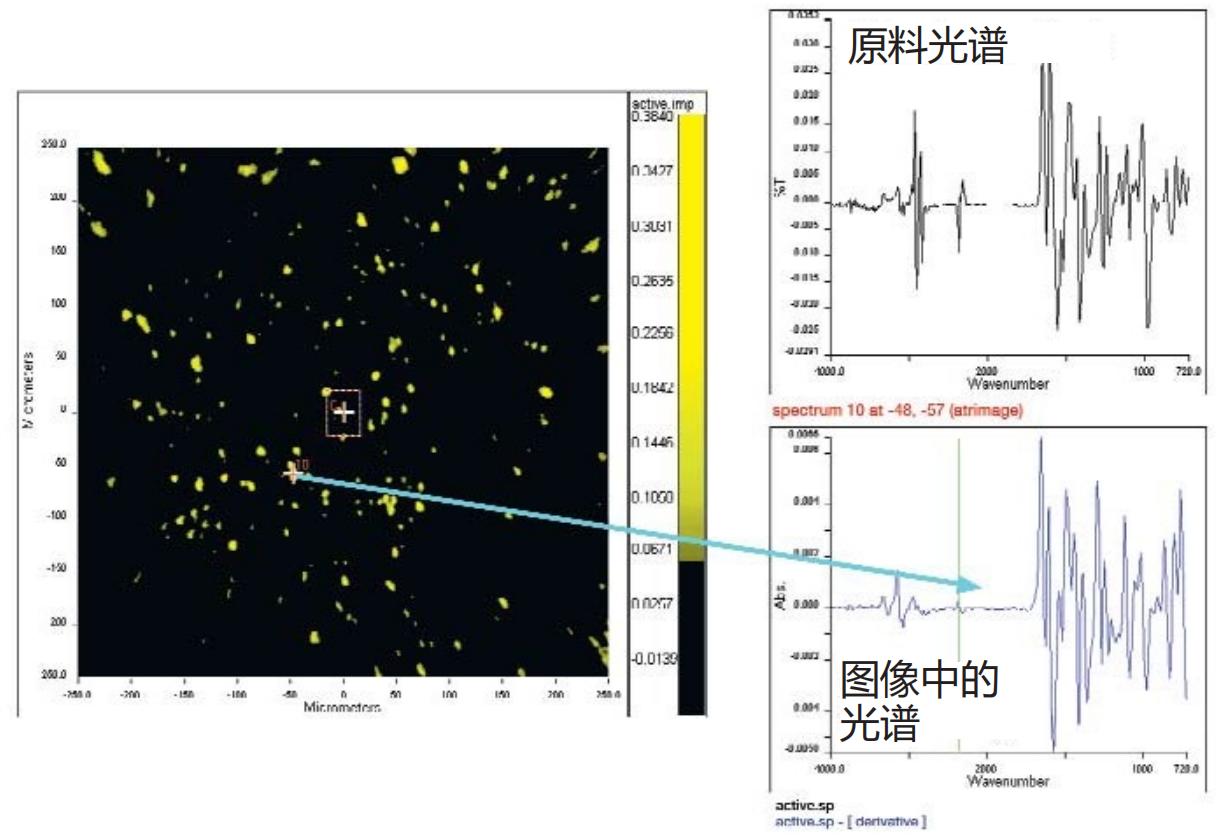
Figure 5e. Distribution of active ingredients (<1%)
In most cases, the "hotspot" areas in the derived image exhibit features similar to the pure component spectrum, while the pixels at the edges of the particles exhibit the expected "mixed" spectral features.The figure shows typical hotspot spectra and corresponding raw material spectra.
These images exhibit three significant features:
1 The spectral contrast and image clarity are extremely significant, far exceeding the images produced by most NIR imaging techniques. This can be easily verified by drawing the histogram distribution of the image.
2 The hotspots (particles) of different components not only have shape differences, but also begin to exhibit shapes similar to those of the raw material particles. For example, Figure 6a shows a scanning electron microscope (SEM) image of starch granules, revealing that the starch granules are highly spherical, which is different from many other components. The corresponding ATR derived image (Figure 6b) shows particles with similar shapes. Similarly, the irregular shapes of magnesium stearate and microcrystalline cellulose regions are highly consistent with the SEM images of the raw materials. This discovery is attributed to the improved imaging fidelity compared to NIR, providing additional important evidence for understanding the correlation between spatial distribution and product quality attributes.
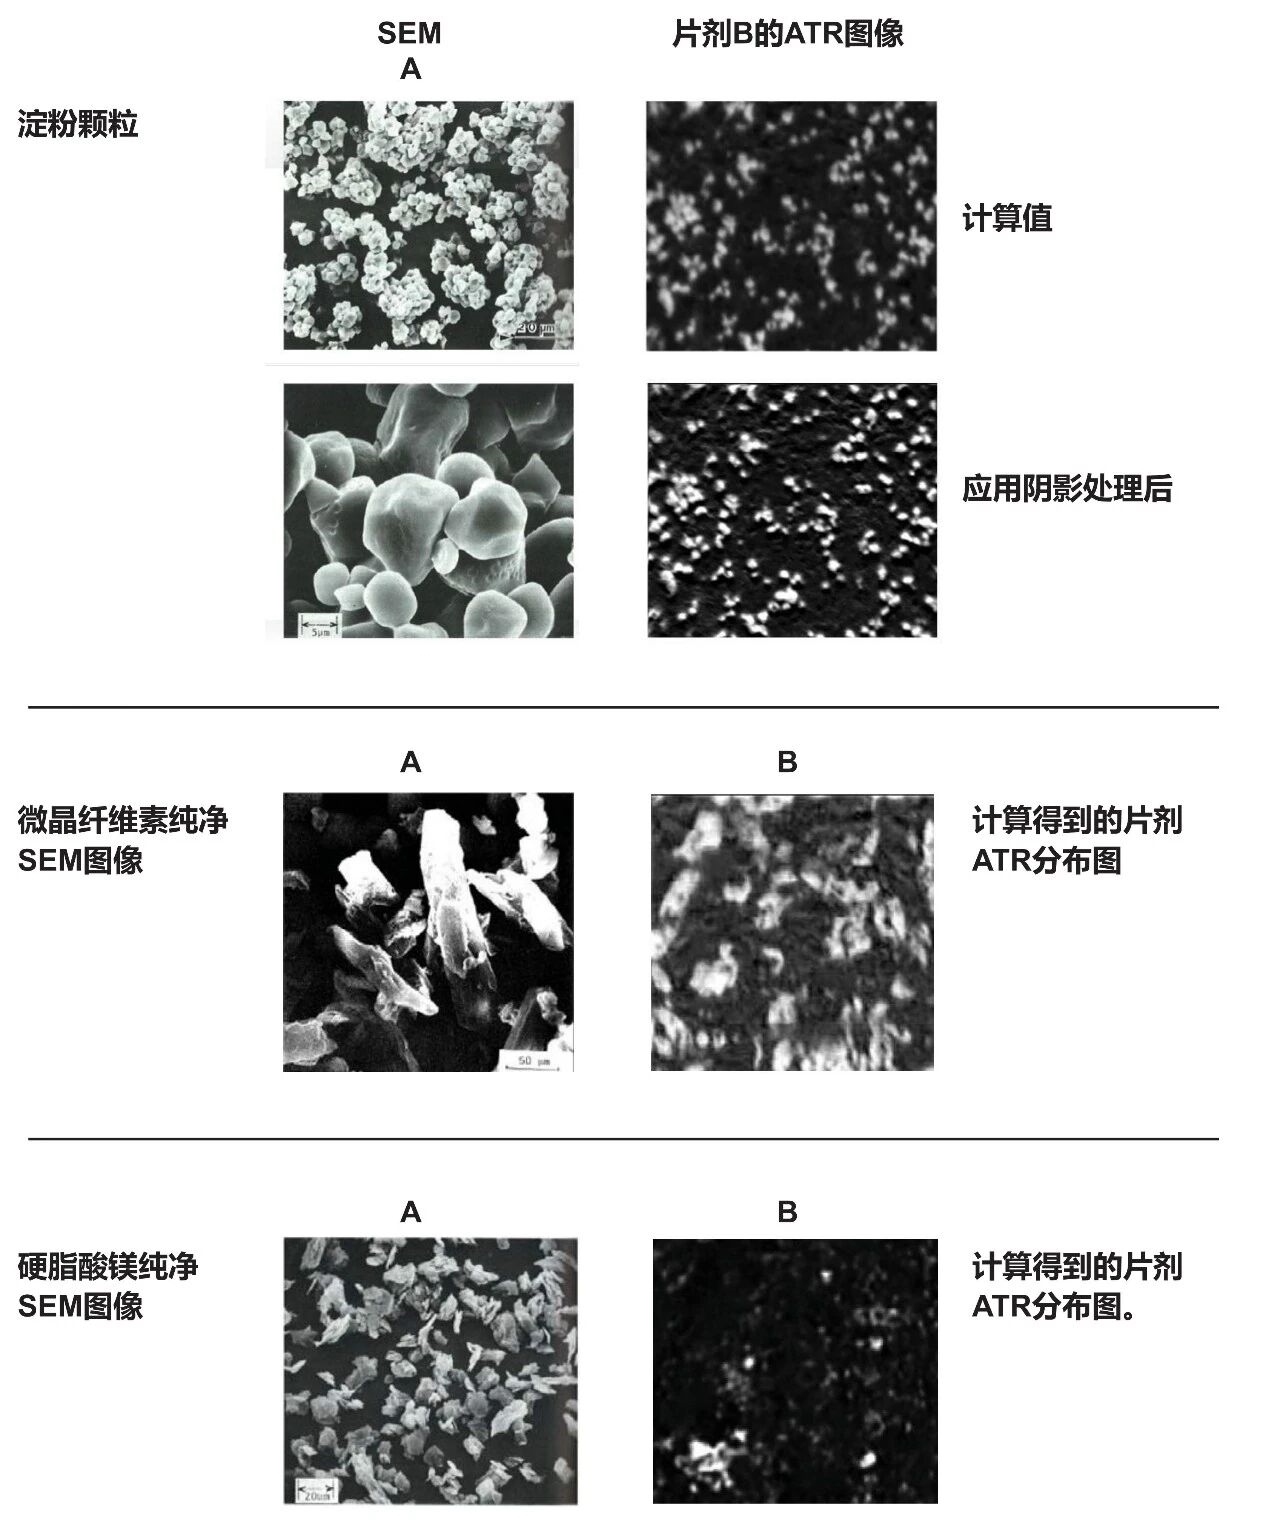
Figure 6. ATR Particle Image Shape - Comparison with SEM
3 This technology can distinguish individual particles below 10 microns. Figure 7 shows an enlarged area of the calculated distribution map of the active ingredient, which has a known concentration of less than 1% (by weight) in the tablet, with visible hotspots with diameters of 6-7 microns. The spectrum at the hotspot indicates that many pixels almost completely present the pure spectrum of the active ingredient. It is worth noting that the independent resolution study 6 estimates that the spatial resolution of this technique can reach the order of 3-4 micrometers near the wavenumber of approximately 1700 cm-1, and the clarity of single particle spectra is also outstanding.

Figure 7a. Distribution of active ingredients (<1%)

Figure 7b. Active ingredient particles<10 microns
The second example is shown in Figure 8, which illustrates the resolution of small particle sizes. This example performed imaging analysis on a certain OTC soluble analgesic tablet.NIR imaging technology often uses such products as demonstration samples to demonstrate its analytical capabilitiesIts main components - aspirin, acetaminophen, and caffeine - are distributed in large areas with particle sizes ranging from tens to hundreds of micrometers. But this example not only presents the images of the main components mentioned above, but also successfully presents excipients with the following characteristics: (a) low content; (b) More importantly, its distribution area size is less than 10 microns. Although many excipients and active pharmaceutical ingredients (APIs) have an initial particle size of less than 10 microns, NIR imaging technology is difficult to detect individual particles at this scale and can only detect larger aggregates formed by these particles. The figure not only shows the main components, but also individual calcium phosphate particles that cannot be detected by NIR in the distribution of aspirin/caffeine/acetaminophen.
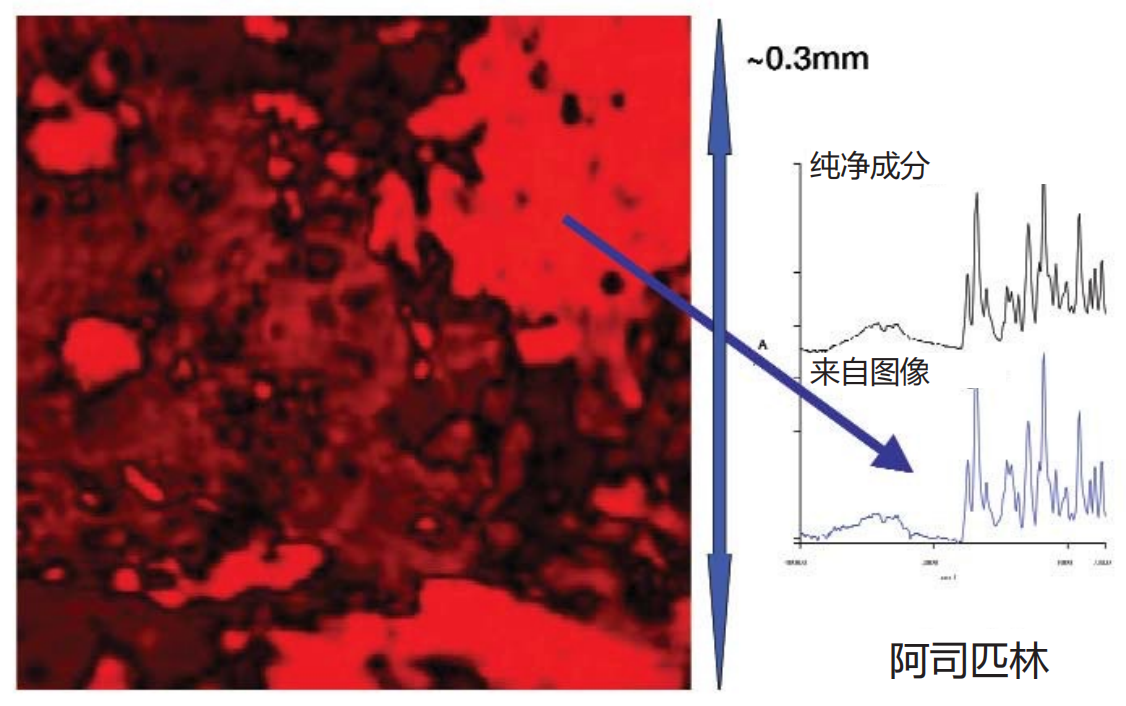
Figure 8a. Pain relievers - Overall structure - Aspirin
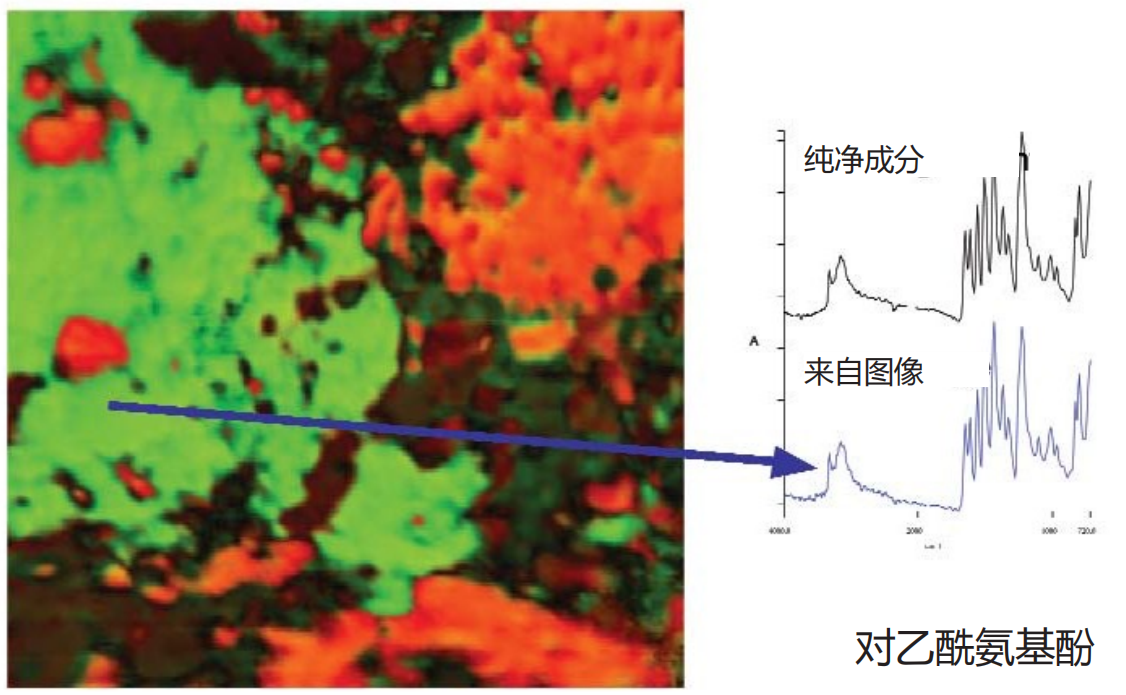
Figure 8b. Overlapping distribution of acetaminophen

Figure 8c. Overlapping distribution of microcrystalline cellulose
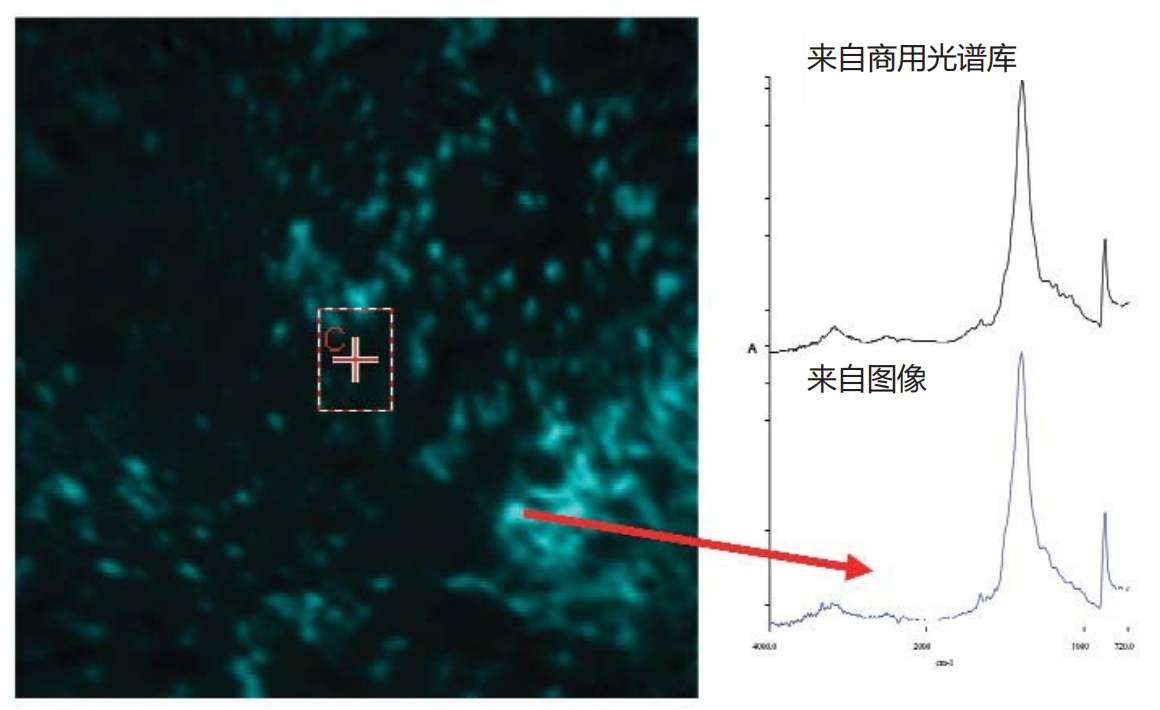
Figure 8d. Revealing trace components - calcium carbonate

Figure 8e. Decomposed View of Calcium Carbonate Image

Figure 8f. Calcium carbonate in aspirin area
04 Characterization of tablet component distribution
High quality single component distribution diagram as shown in Figure 9The human eye can observe significant differences between different components in the tablet. But if faster and more objective representation is required, different image expression methods need to be used. One method isHistogram representation of image intensityThe conventional method is to plot the corresponding pixel brightness based on the number of pixels for a specified image, and obtain useful information related to the key process parameters of the tablet by analyzing the generated histogram. For high-definition ATR images, when the component distribution map is drawn in this way, the generated histogram usually presents two different patterns, corresponding toTarget particle swarmandRemaining particles(as shown in Figure 9a). However, the boundary between these two histogram regions is not always clear and distinguishable. Due to this being a grayscale image, there will be a large number of pixels between "pure" granular pixels and "pure" background pixels. When performing pixel counting, these pixels need to be classified as foreground pixels or background pixels, that is, an intensity threshold must be set: pixels above this threshold belong to target particles, and pixels below this threshold belong to background pixels.
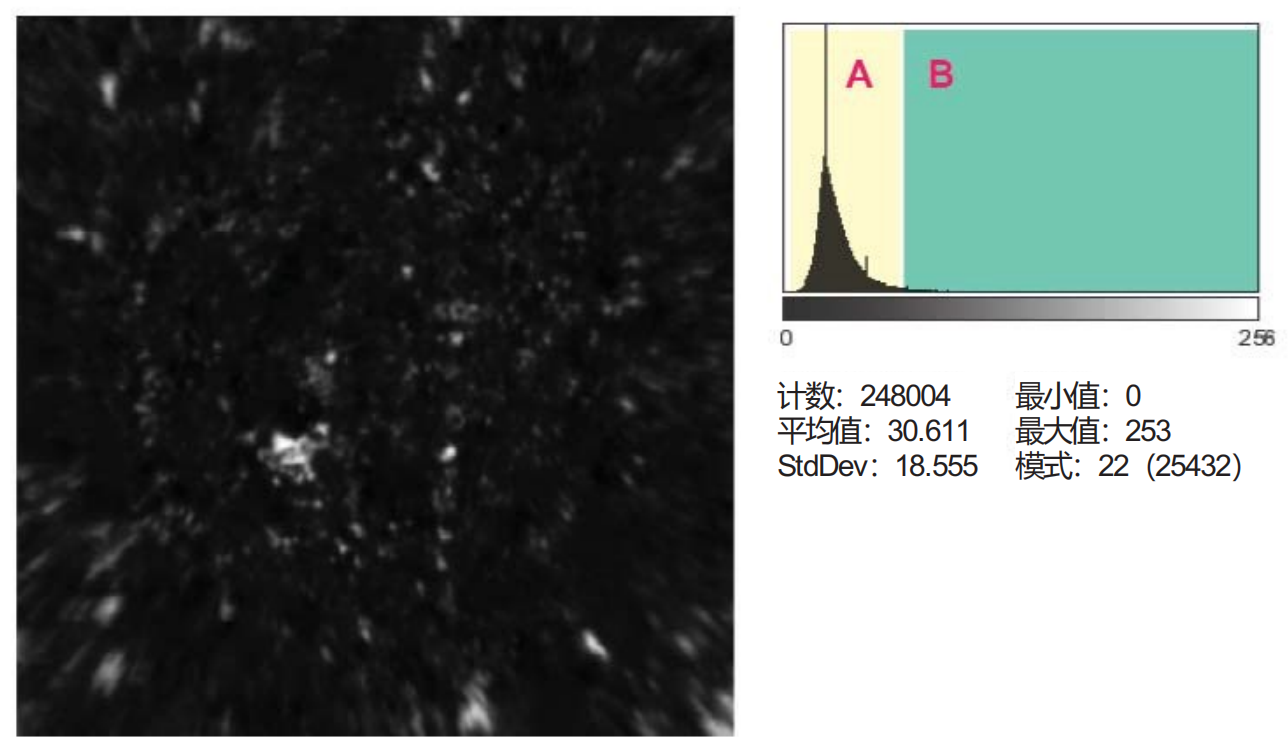
Figure 9a. Histogram of individual component distribution (click to view larger image)
The threshold can be determined through mathematical algorithms (such as the "maximum entropy method" ⁵) or based on subjective experience. For ATR image analysis, it has been found that combining the following information to determine the intensity threshold is very useful: raw material particle size, iterative threshold adjustment, and inspection results of underlying pixel spectra.
Figure 9b shows the threshold setting process:The figure shows a computed grayscale image of component distribution, with intensity thresholds set at two levels to preserve the image pixels with the highest intensity. Which image is correct? Although a detailed discussion of this issue is beyond the scope of this article, the setting of this threshold is crucial for obtaining accurate quantitative information from these images and must be handled with extreme caution. However, when calculating a clear and distinguishable particle distribution, certain statistical results obtained (such as average particle size, distribution shape, nearest neighbor information, etc.) are associated with product quality attributes.
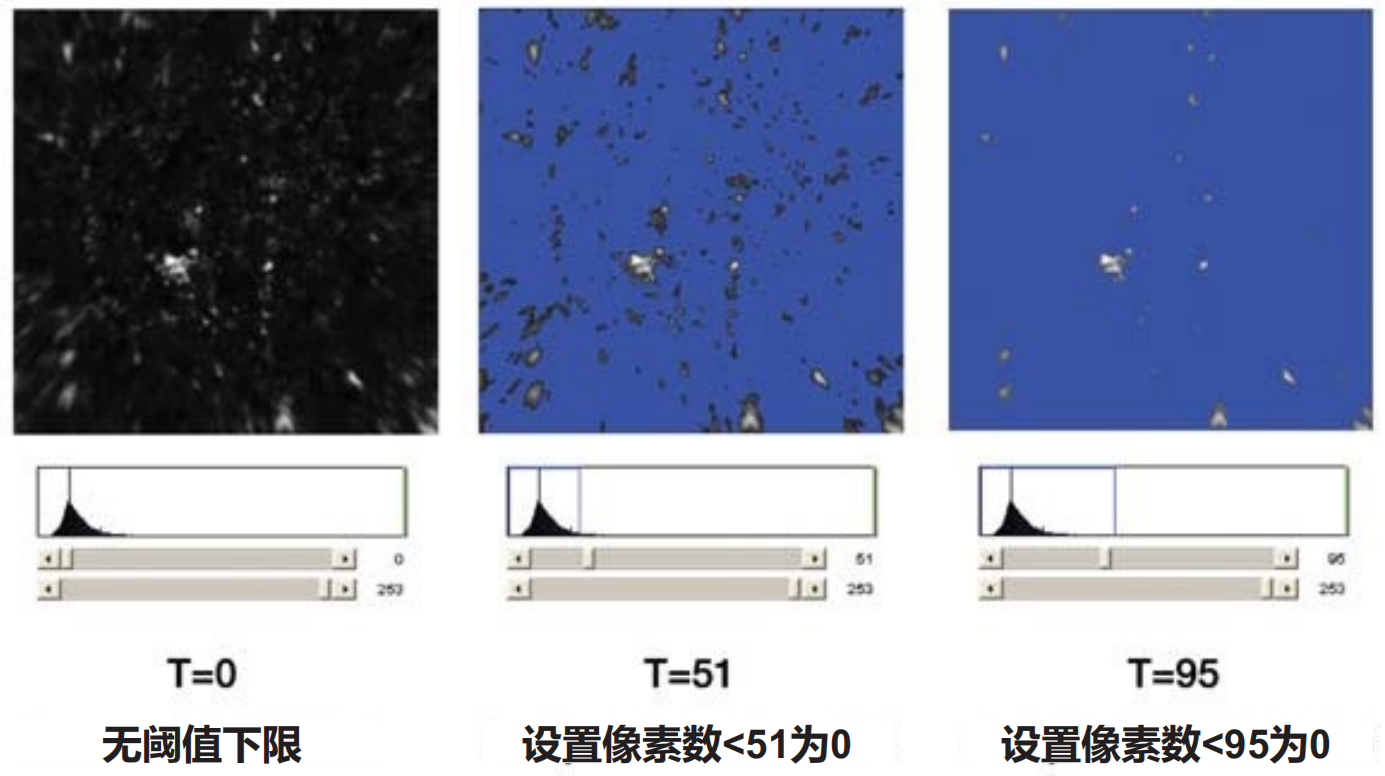
Figure 9b. Setting A-B threshold to generate binary image (click to view larger image)
Figure 9c shows a comparison of the calculated component distribution of a specified ingredient in two batches of products marked as "qualified" and "unqualified".Five images of different samples from qualified and unqualified batches were collected separately. The average particle size calculation results of all components in the qualified and unqualified batches are consistent, except for one component. For this particular component, all images show that the average particle size of the unqualified batch is about twice that of the qualified batch. This type of information has extremely high value for identifying production process issues.
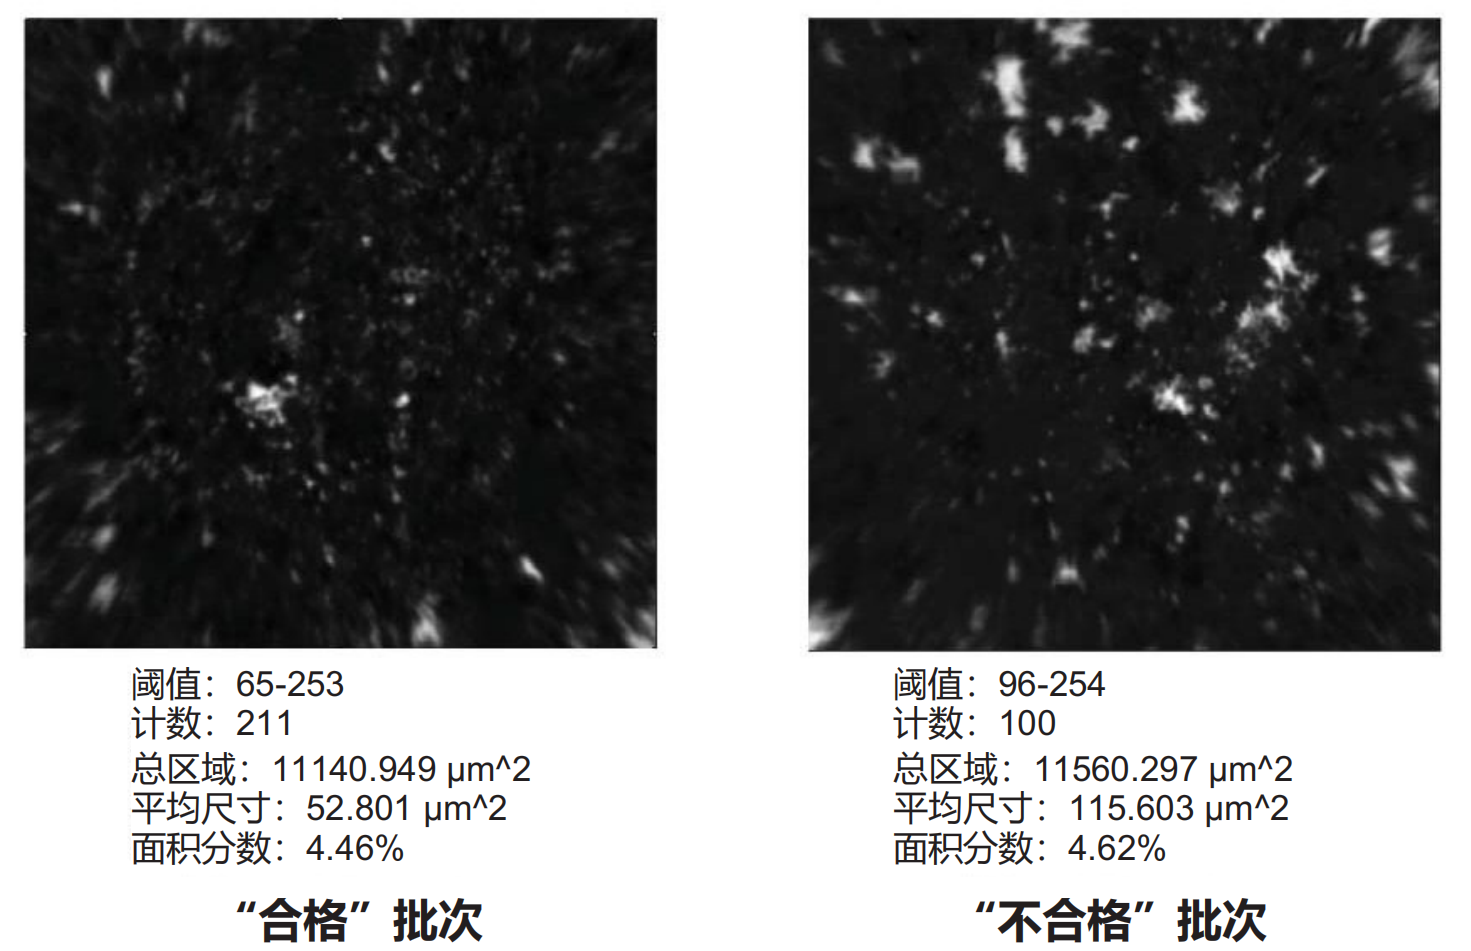
Figure 9c. Some indicators can be associated with quality parameters (click to view larger image)
Conclusion
ATR chemical imaging technologyImproved chemical imaging of certain types of drug tabletstechnical levelCompared with NIR chemical imaging, this technology can significantly improve the achievable spatial resolution of images and obtainClearer and usually easier to interpret imagesThis technology overcomes the main limitations of direct diffuse reflectance imaging in mid infrared spectroscopy analysis, namely high signal attenuation and uncontrolled specular reflection interference in the image. simultaneouslysolvedMultiple defects in Raman imaging, includingSample overheating, potential fluorescence interference, limited spatial resolution(depending on the Raman imaging hardware configuration) andThe image acquisition time is relatively long.
References
1. Lyon, R.; Lester, D.; Lewis, E. N.; Lee, E.; Yu, L. X.; Jefferson, E. H.; Hussain, A. S.: AAPS
PharmsciTech 2002; 3 (3) article 17.
2. Clarke, F.; Vib Spec., 34 (2004) 25-35. Available online at www.sciencedirect.com.
3. Lewis, E. N.; Schoppelrei, W.; Lee,E.; Kidder, L.; in ‘Process Analytical Technology’ Blackwell, 2005. ISBN-10 1-4051-2103-3.
4. Canas, A.; Carter, R.; Hoult, R.; Sellors, J.; Williams, S.; ‘Spatial resolution in mid-IR ATR Imaging:Measurement and Meaning’FACCS conference, 2006.
5. Rasband, W.S., ImageJ, U. S.National Institutes of Health, Bethesda, Maryland, USA,1997-2006.
6. ‘Spatial Resolution in FT-IR ATR Imaging’ PerkinElmer Technical Note # 007641_03 (2006).